LogTag Temperature Recorders

[email protected]

SUPPORT

Reading your LogTag data

Most users will download data either once a day or once a week, depending on requirements and regulations. With LogTags, the process is quick and simple.

Reading your LogTag data

Most users will download data either once a day or once a week, depending on requirements and regulations.

With LogTags, the process is quick and simple.

If you get stuck on anything have a look at our support page https://www.logtag.com.au/troubleshooting/, or call us on 1300 08 20 20.

Step 1

Open the LogTag Analyzer software.

Step 2

Retrieve the LogTag from the refrigerator or freezer.

Step 3

Read the data as follows …

LOGDISPreader

Connect the LogTag Reader

If it not already connected, plug the LogTag Reader cradle into a USB port on your PC

Insert the LogTag into the Reader

Insert the LogTag in the Reader so that the metal contacts at the back touch the contacts in the reader.

LogTag with USB Connection

Plug the LogTag into the USB Port

The LogTag with USB will connect to any USB port on a Windows PC.

In some cases, the physical size of the LogTag makes it difficult to insert into laptop ports. If this is the case, you can buy a short USB extension from most computer stores that will make it easier.

A box (Figure 1) will briefly appear telling you that the Reader has found your LogTag.

LogTag-Getting-Started-Figure-1
Figure 1

The Reader will read the data from your LogTag and save it to your computer.

By default, it will save to your My Documents folder in a folder called My LogTag Data. (To change this location go to the top menu and choose Edit>Options and choose the Configurations Log tab.)

Once the data has been saved, LogTag Analyzer will automatically open your report.

LogTag Analyzer Auto Download On

Important: As soon as the report appears, you know that the data has been saved, so it is OK to remove the logger from the reader (or the USB port) and return it to the refrigerator.

The Report

There are four parts to the report:

  1. Report
  2. Graph
  3. Data
  4. Summary

By default, the graph will show first. The other sections can be accessed by clicking on the tabs at the bottom of each page.

Four Parts of LogTag Reportt

What to look for

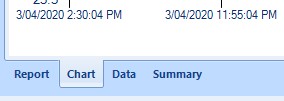
The easiest way to check if everything is OK is to click on the Report Tab at the bottom of the screen.

At the top left of the Report should be two green ticks showing the Alarm Status for both low and high temperatures.

status

If you have a red cross, instead of a tick, you know something is wrong. Look for a section of the Report labelled Recorded Data.

In the second column of this section it will show you the Temperature Statistics, including the lowest and highest temperatures experienced by the logger.

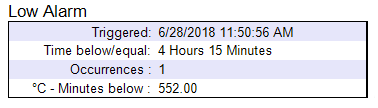
Below this, you will find details of the alarm. This will tell you how long the temperatures were out of range.

LogTag low alarm